The energy crisis hitting Europe from more than a year now has had an historical impact on gas and power markets, with prices reaching unprecedented volatility levels. Such prices shake all market players, put them under severe financial pressure and open a wider eye on how the actual energy market is structured and traded.
The status of the TTF gas hub as the main European gas price benchmark has been challenged in this context, due to a surge in LNG imports and a progressive disappearance of Russian pipeline gas flows.
In this special report, we try to analyze the impact of the crisis on some key metrics often used to take the pulse of market liquidity. You’ll find below some of our main conclusions. The full report is available for Premium users in our EnergyScan platform.
Summary:
- What is liquidity and why is it important?
- How are natural gas and power traded?
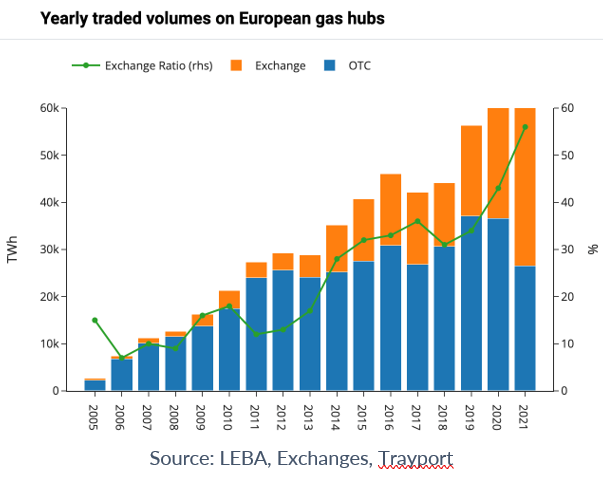
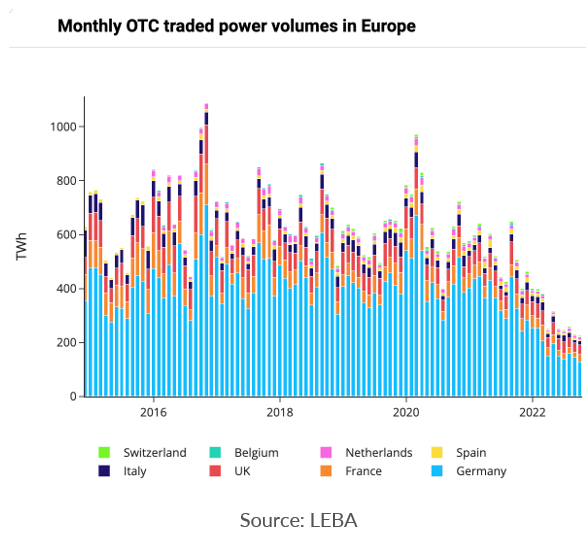
- How are the trading activities evolving?
- TTF front-month and German base CAL+1 contracts remain the main gas and power benchmarks
- Bid-ask spreads have surged, following intraday volatility
- Conclusion: which outlook for energy market liquidity in Europe?
1. What is liquidity and why is it important?
As a reminder, the European Union launched the liberalization of gas and power markets at the end of the 1990’s to improve competition on supply to end users, open infrastructure access to third parties and bring transparency on energy prices.
The creation of gas and power hubs was the finality to get a transparent and trustful reference price.
In a traded market or trading hub, liquidity refers to several related factors, such as the number of active participants in the market, the size of bid-offer spreads in the market or the volumes that can be traded without moving the market, etc…
Liquidity itself tends to develop as market players become more confident in the fairness of a market.
And once liquidity increases, it tends to form a virtuous circle. Finally, a liquid hub provides multiple benefits such as a trusted price reference, an easy access to a large supplier and customer base and the possibility of managing volume risk for all market participants at a competitive cost.