
Gas & Power Report: Bumpy start for energy markets in 2025
Gas & Power Report: Bumpy start for energy markets in 2025 January, 16 2025 Gas & Power In this first Gas & Power podcast of…
The rise in crude oil prices continues. Brent crude is approaching $120/bbl this morning, its highest level in 10 years. A few more $/b and the 2011 and 2012 highs will be surpassed, leaving only the prospect of reaching the $150/b of 2008.
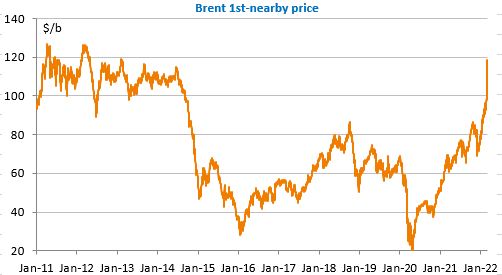
WTI has already topped $116/b, while the Russian benchmark, Ural, is trading (or rather not trading) at a discount of $18/b to Brent. Whether due to logistical problems of financing or insurance, trading in Russian oil, theoretically spared by the sanctions, is in fact significantly reduced. Estimates range up to a 70% drop, which would represent a shock of nearly 5mb/d in total (crude and refined products).
In this context, the announcement by OPEC after a lightning meeting (timed at 13mn, which means nothing but the message sent was all the clearer) decided not to change its pace of production increase of 400kb/d. For the moment, Saudi Arabia and its close neighbours (Kuwait, UEA), the only ones to really have production capacity available, are refusing to position themselves against their Russian partner within OPEC+ and to supply the market. One can also imagine that Iran feels its position is considerably strengthened in the perspective of putting its oil back on the market, which must seriously complicate the latest negotiations on the nuclear issue.
In the US, the decline in crude oil inventories last week (see here for more details) was anecdotal. But it is confirmed that production is still not increasing. For the moment, there is no alternative to Russian oil on the market.